GTA 6 Sick-Day Claim: Can Launch Day Really Cost $1 Billion?
Status labels
Confirmed stated by Rockstar Games, Take-Two or a platform holder. Analysis our reading of official material. Not announced no official information yet.

The GTA 6 sick day claim remains unverified. It is not an official forecast or a measured economic loss. Reports pair 1.5 million absent US workers with $1 billion in lost productivity, but the reviewed sources do not show how those numbers fit together. The claim also combines questions that need separate answers: who takes leave, which hours are missed, and how much work never gets done.
News analysis · Sources checked October 23, 2026.
There is a confirmed date to plan around. Rockstar Games lists Thursday, November 19, 2026 for GTA VI’s release. As of this article’s verification on October 23, launch day is still ahead, so claims about that day’s actual nationwide losses are premature.
The useful response is to check the sources, do the math, and explain what the numbers measure. If 1.5 million workers each miss eight hours at $46.89 an hour, the result is $562.68 million in gross labor-cost exposure. That sum does not show that the absences will happen, or that output worth the same amount will be lost. Our GTA 6 release-date guide tracks the scheduling facts separately.
Key Takeaways
- The 1.5 million US-worker headcount remains unverified; it is not a measured leave count.
- A hypothetical 1.5 million absences lasting eight hours at $46.89 an hour produces $562.68 million in gross cost exposure, not measured GDP loss.
- Approved leave, unexpected absences, and permanently lost output are different categories.
- Recovery, replacement staffing, timing, and the hourly measure can materially change the interpretation.
Source status, checked October 23, 2026: The release date has official support. The national headcount and combined $1 billion model do not have verified primary support in the material reviewed. The calculations below are original arithmetic using stated assumptions, not a study. Unverified does not mean disproved.
Where the GTA 6 sick day claim comes from
The reporting spans 2025 and 2026. It does not document a newly measured wave of absences. Keeping those dates visible helps readers tell an older claim from fresh evidence about work and leave.
An Instagram screenshot supplied to ViceLens, displaying the account name @bilimlebak, repeats the two figures in Turkish. We were not supplied a post permalink or a verifiable publication timestamp. The screenshot shows the claim that prompted this analysis; it does not establish who first calculated the figures or authenticate the post’s history. We have not reproduced the screenshot’s unrelated personal-profile images.
Cadena SER’s July 28, 2025 article reports roughly $1 billion in potential absenteeism losses beside economist José Montalvo’s comments. Its text gives no 1.5 million headcount or calculation. It does not show that he supplied every input.
IBTimes UK’s September 7, 2026 report displays an 08:27 BST publication time. It attributes the paired headcount and dollar estimate to Montalvo. It also adds an annual-output figure and a productivity percentage, but links no paper, survey, or model supporting those inputs. The report labels its annual figure as output, not salary.
A separate IBTimes article displayed at 09:03 BST that day explicitly treats the headcount as unverified. The timestamps are 36 minutes apart. They establish the displayed publication order, not a verified correction notice or a complete history of changes to either page.
The outlet’s October 20 assessment also acknowledges missing survey support and unexplained arithmetic. These qualifications help readers assess the reporting, but several articles from one publisher do not constitute independent economic confirmation.
The headcount’s original source remains unclear. This review did not find a national survey, dataset, or launch-day model that supports it and can be checked. That finding concerns the material reviewed; it does not prove that supporting work cannot exist. Our official GTA 6 facts and data reference separates confirmed facts from claims in circulation.
What the sources establish, and what they do not
The evidence supports the existence of a widely circulated claim. It does not yet support treating its two headline numbers as a validated national forecast.
| Claim or input | Source and status | Editorial verdict |
|---|---|---|
| Thursday, November 19, 2026 release | Rockstar’s official announcement, checked October 23 | Confirmed schedule as of verification |
| Roughly $1 billion absenteeism estimate | July 2025 reporting identified above | Reported estimate; underlying calculation unresolved |
| 1.5 million US workers missing work | Later coverage and its qualification | Unverified headcount, not observed attendance |
| $46.89 hourly compensation reference | BLS June 2026 private-industry data | Usable as a labeled illustrative cost proxy |
| $562.68 million at the stated inputs | Original multiplication below | Reproducible scenario, not economic measurement |
A hypothesis predicts what might happen under stated conditions. An observation records what happened. A causal estimate goes further: it asks how the outcome differs from what would have happened without the event. Each step needs more evidence than the last.
Even a verified drop in attendance on November 19 would leave questions open. Some workers would have been absent anyway. Some workplaces might have arranged cover. Some tasks could move to another day with no drop in work done over the week. To show a national output effect caused by the game, researchers would need evidence for those links. A count of empty desks would not be enough.
One person’s leave plans can show interest without telling us how many people will do the same. An expert’s credentials do not mean their university endorses every figure printed near their name. This analysis uses written sources. It includes no audio quotes or claimed transcript of the broadcast.
The arithmetic behind a $1 billion headline
The simplest model multiplies workers by absent hours and an hourly cost. All three are inputs chosen for the example. The result is gross cost exposure: the entered hours valued at the entered rate, before any work is caught up.
The Bureau of Labor Statistics’ Employer Costs for Employee Compensation reports June 2026 private-industry compensation averaging $46.89 per hour worked: $32.82 in wages and salaries plus $14.07 in benefits. The release was September 9. This broad employer-cost measure does not measure output, marginal expense, or the compensation of workers who might play GTA VI.
Gross exposure = workers × absent hours per worker × assumed hourly cost.
Using the unverified headcount strictly as a scenario input:
1,500,000 × 8 × $46.89 = $562,680,000.
All three inputs need labels. The worker count is unverified, eight hours is an assumed missed shift, and the hourly figure stands in for labor cost. Doing the math cannot turn uncertain inputs into observed facts.
What inputs would reach $1 billion?
A billion-dollar result is possible with different inputs. Holding 1.5 million workers and eight hours fixed requires:
$1,000,000,000 ÷ (1,500,000 × 8) = approximately $83.333 per hour.
Alternatively, holding eight hours and $46.89 fixed requires:
$1,000,000,000 ÷ (8 × $46.89) = approximately 2,665,813.606 workers, or 2,665,814 whole workers.
These sums work backward from the headline. They do not estimate likely pay or attendance. They show what the missing inputs would need to be, without proving the headline or ruling out every model that could produce it.
Why an annual figure needs a daily conversion
An annual salary assumption cannot be multiplied directly into a one-day loss. Consider a separate illustration using $70,000 a year and 260 assumed working days:
($70,000 ÷ 260) × 1,500,000 = $403,846,153.85, or approximately $403.85 million.
The 260-day divisor is a choice for this example, not a verified part of the reported estimate. If $70,000 means salary, the result values a day of wages. If it means annual output, the result has a different meaning. Neither choice proves an actual loss. Before using a large total, check what each input measures and whether its units fit the question.
How exposure changes with the number of absent workers
Changing the worker count changes this simple model proportionally. The table holds the assumed eight-hour absence and $46.89 hourly proxy constant so that readers can see the headcount’s role without changing other inputs.
| Hypothetical absent workers | Assumed absent hours each | Total absent hours | Gross cost exposure |
|---|---|---|---|
| 100 | 8 | 800 | $37,512 |
| 1,000 | 8 | 8,000 | $375,120 |
| 1,500,000 | 8 | 12,000,000 | $562,680,000 |
Source: original arithmetic using the stated inputs and the compensation reference cited above. These are illustrative scenarios, not measured attendance or losses.
The smaller examples help bring the claim down to a team level. A manager needs to know which shifts lack cover. A reader checking the headline needs to know whether there is evidence for the national count. The formula works at either scale. Evidence from one team, though, cannot tell us how the whole country will behave.
This simple scaling has a limit. What happens at work can depend on which people are absent together. A missing specialist might hold up a whole process, while several absences with cover might leave service unchanged. The table includes neither effect.
Recovered work can change the interpretation
Gross exposure starts the calculation. It does not settle the cost. If some work gets done later, a model that treats every absent hour as lost for good will miss that catch-up.
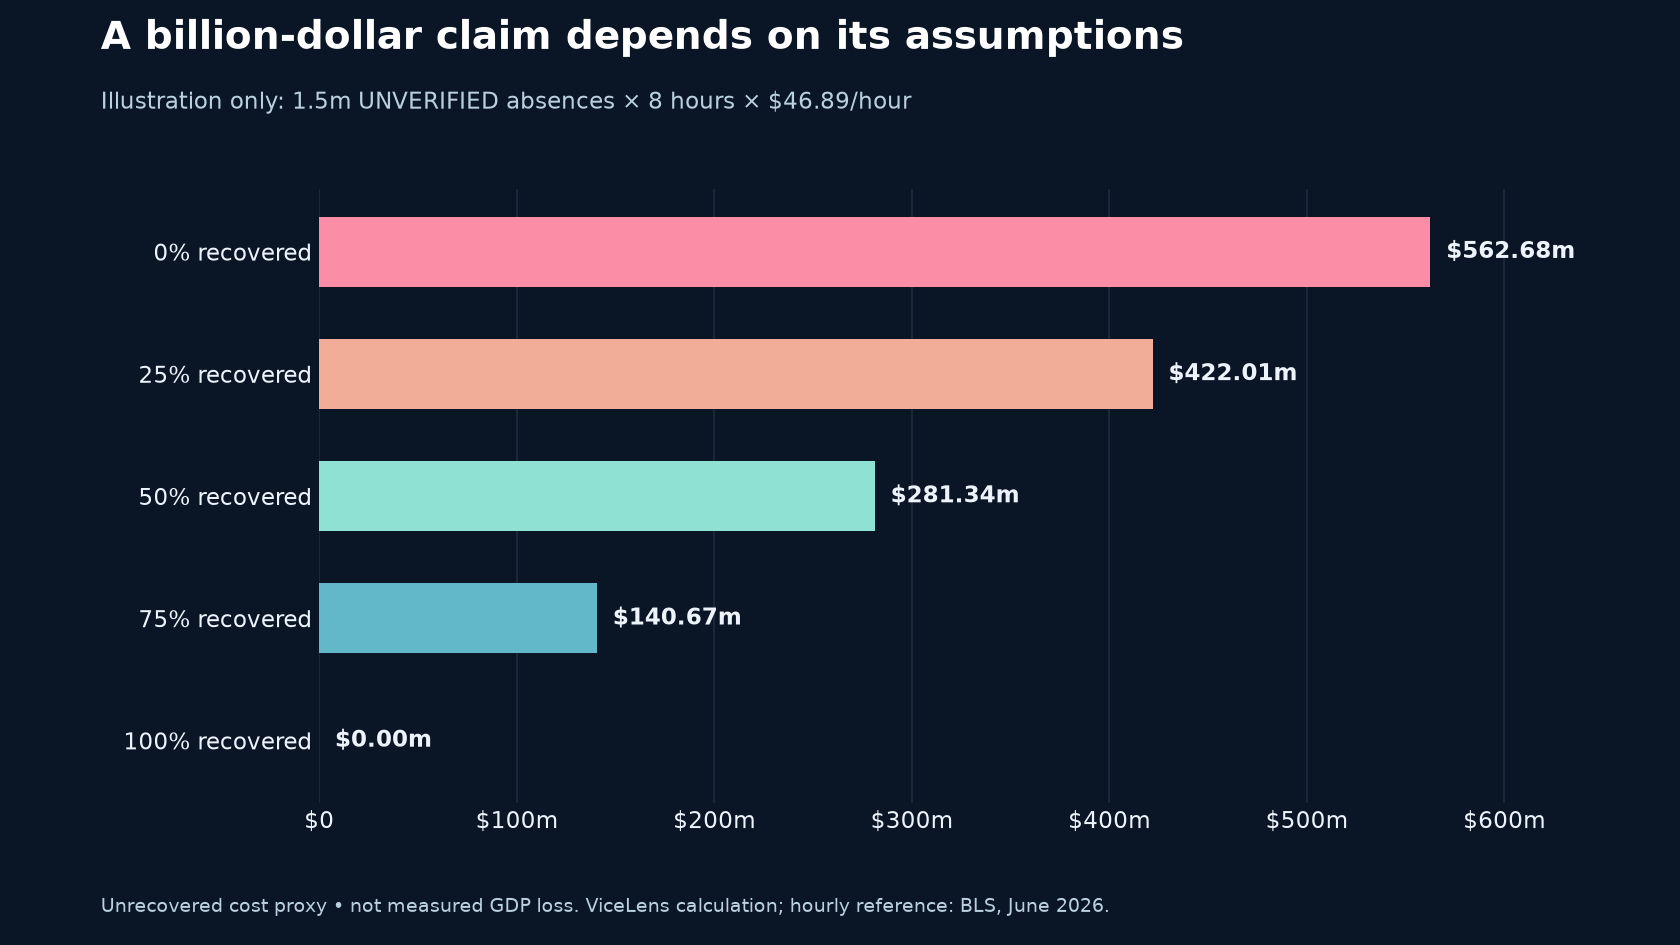
The calculator uses a second, explicitly assumed input:
Unrecovered cost proxy = gross exposure × (1 − recovery percentage ÷ 100).
| Assumed work recovery | Gross exposure at the same base inputs | Unrecovered cost proxy |
|---|---|---|
| 0% | $562,680,000 | $562,680,000 |
| 25% | $562,680,000 | $422,010,000 |
| 50% | $562,680,000 | $281,340,000 |
| 75% | $562,680,000 | $140,670,000 |
Source: original scenario arithmetic. The recovery percentages are selected assumptions, not measured outcomes.
Recovery needs a clear time window. A report sent the next morning might count as caught up over a week, even though it missed a launch-day deadline. A missed appointment or an unserved customer might be harder to recover. Ask what remained unfinished when it was needed.
The formula cuts the cost proxy at the same rate as the work recovered. It does not price overtime, cover, extra handoffs, or the harm caused by delay. If colleagues finish the work by putting off their own tasks, the backlog may simply move. A fuller review would track those tasks too.
Even 100% recovery would mean only that the formula’s unrecovered-work component becomes zero. It would not prove that disruption was costless. Conversely, choosing 0% recovery does not make the gross number a measured loss. Both endpoints describe assumptions.
A worked example: what counts as caught up?
Imagine a team with 100 absent workers, each due to work eight hours. At the hourly rate used above, the gross proxy is $37,512. Suppose half the affected work is done later within the chosen review window. Entering 50% recovery leaves an unrecovered cost proxy of $18,756.
To use that assumption well, first list the work that was due. Then check which tasks were done on time, which were done late, and which were never done. A shared list can prevent two teams from each claiming that the other caught up the same task. Keep the review window fixed so that changing dates does not quietly change the result.
Next, ask how the late work got done. If it used spare capacity, the team may have absorbed the delay. If it required paid overtime or outside cover, those expenses belong in a separate record. The calculator does not add them. If a late task lost its value after a deadline, marking it complete does not mean its full value was recovered.
This example also shows why recovery is about work, not a refund of wages. Entering 50% does not mean half the payroll comes back. It means the reader assumes half the affected work is restored, then applies that share to a simple cost proxy. The result is only as sound as that assumption.
Approved leave, unexpected absence, and lost output are different
Taking a planned day off does not show that a workplace lost an extra day’s output. The question is what happened to the work compared with what would have happened otherwise.
Approved paid time off is a scheduling category. An employer may have planned around it, moved deadlines, or arranged coverage. If someone moves a vacation day from another week to launch day, the annual leave total may be unchanged even though staffing pressure shifts to November 19.
An unplanned absence is a coverage problem. It may create a gap with little notice. The effects depend on the role, available substitutes, and whether the work has a strict deadline. An attendance record alone cannot supply a reliable dollar value for those consequences.
Lost output is a result that needs to be measured. It could mean fewer orders filled, missed appointments, late deliveries, or unfinished projects. Each case needs a baseline and a rule for counting work done later. These are examples of what to check, not reported GTA VI outcomes.
Double counting is another trap. Suppose a review counts a worker’s whole labor cost as lost output, then adds the full cost of someone who fills in and does the same work. That mixes costs with output that may not have been lost. Report added staffing costs and changes in work done separately before trying to combine them.
Nor should remote work be treated as an absence indicator. A person’s work location does not show whether tasks were completed or whether leave was approved. Planning around known availability is more useful than inferring behavior from a demographic profile or a gaming interest.
Why GDP, hourly costs, and game revenue cannot be swapped
Labor costs, output, and sales answer different questions. All can be stated in dollars. That does not mean they measure the same thing about the launch.
An hourly labor-cost proxy puts a price on time. GDP measures value added across the economy. Take-Two’s game revenue comes from sales. A sum built from the first measure cannot be renamed as the second or simply canceled by the third.
Imagine a worker who buys the game with money already set aside for fun. That purchase might replace another one. It does not show what happened to the worker’s job output, whether they missed any work, or where value was added. The buyer and the employer also keep separate accounts. A sale to one does not repay a cost faced by the other.
Matching a guessed output loss to a sales number does not show that the same money changed hands. A net-impact study would need to define the place, period, types of value counted, and what buyers would otherwise have spent. This article makes no launch-revenue prediction and offers no investment conclusion.
A productivity percentage needs a denominator
A hypothetical 2% claim needs to say 2% of what. Does it mean workers, planned hours, work done, or output per hour? Which people and which period does it cover? Each choice changes the claim.
Conditionally, 1.5 million people would equal 2% of a population of 75 million. That is arithmetic, not evidence that 75 million is the relevant workforce. It also says nothing about hours or productivity. For output, a $1 billion decrease would equal 2% only against a $50 billion baseline measured on the same basis.
Neither example shows a measured GTA VI effect. Past research linking leisure to working time cannot tell us the missing launch-day baseline. That would need its own model and evidence.
Use the GTA 6 launch-cost calculator as a scenario tool
The calculator lets readers change inputs and check the math above. It does not estimate how many people will miss work, retrieve workplace records, or forecast national GDP.
Launch-day absence scenario calculator
Illustrative cost exposure, not a forecast of GDP or confirmed absenteeism. The starting worker count repeats an unverified viral claim.
Starting example: 12,000,000 absent hours × $46.89 = $562,680,000 gross exposure. With 0% recovery, the unrecovered cost proxy is $562,680,000.
The $46.89 reference is BLS private-industry total compensation per hour worked in June 2026. It is neither marginal cash expense nor output per hour. No input is sent to a server or stored.
Enter four things: a whole worker count, hours missed per worker, an hourly cost, and the share of work caught up later. The tool returns absent hours, gross cost exposure, and an unrecovered cost proxy. The last label means the part left after assumed catch-up. The results depend on what the inputs mean and how sound they are.
For a workplace example, start with expected absences in the team you want to review. There is no need to use the viral national count. Enter the hours at issue, which may be less than a full shift. Choose a cost that fits the question. Label it as wages, pay plus benefits, or another input you can justify.
Then change one input at a time. Hold the worker count fixed and change recovery to see how much catch-up matters. Hold recovery fixed and change absent hours to test whether the full-day assumption drives the result. These checks show which choices matter most. They do not tell you which choices are true.
Zero has a specific meaning. Zero workers, zero absent hours, or a zero hourly cost produces zero gross exposure. Zero recovery retains the full gross proxy; 100% recovery reduces its unrecovered component to zero. A zero hourly input does not demonstrate that people’s time has no value.
Invalid inputs should not produce a result. Negative values are rejected. Worker counts must be whole numbers. Hours cannot exceed 24, and recovery must stay between 0% and 100%. Entries must be finite numbers; the displayed upper limits also apply. A blank field is not a valid zero.
Extremely large combinations are also rejected when the calculated amount exceeds the tool’s reliable cent precision. In that case, reduce one or more inputs rather than relying on an imprecise total.
The tool uses the same hours and hourly cost for everyone entered. It cannot split a group into people with different jobs or shifts. It also leaves out overtime, hold-ups, demand changes, and cover costs. Its math helps readers check a claim, but it is not a study. Records of who was absent and what work got done would still be needed. Our editorial policy explains how we present evidence and its limits.
Practical launch planning without the national guesswork
Workers and employers can plan around the date without using a guessed national loss figure. The practical task is to agree who will be available, what they need to do, and when it is due.
For workers planning time to play
Use the normal process to ask for leave. Check that the time has been approved before relying on it. Give colleagues what they need for a handoff: tasks still open, due dates, and where to find the right files. Clear dates and notes help others plan their own work.
Keep sick leave for illness separate from plans to play. There is no need to make up a medical reason to ask for time off. The viral sick-day label should not be used to mislead a workplace. It also tells you nothing about your rights under a leave policy.
Check game setup as a separate task from booking leave. Our GTA 6 launch checklist covers things to prepare, while the platform guide helps check which system to use. Buying the game or getting time off does not tell you when a download or play session will start.
For employers arranging coverage
Review approved leave, key shifts, handoffs, and due dates through the normal work schedule. List tasks that need cover and tasks that can move without harming service. This check is useful for any time when several people ask for leave at once.
Discuss who will be available. Do not guess who will be absent because they enjoy games. If plans change, record the gap in cover and what it meant for the work. That gives a team facts it can use without treating someone’s hobby as proof of misconduct.
Afterward, compare planned and actual attendance with work done over a suitable period. Keep added staffing costs, late work, and work never done in separate records. These are general planning points. They do not interpret leave law or tell anyone how to handle a dispute at work.
What evidence would change the verdict?
A credible headcount needs a method readers can check. A credible loss estimate also needs a model linking absence to output. Better evidence for one would not settle the other.
Before launch, a well-designed survey could help test the headcount. It would need to say who was asked, when, how they were chosen, how answers were weighted, and what margin of error applies. The questions should separate approved leave, planned unannounced absences, shorter hours, and people who were never due to work. Plans would still differ from what people later do.
After launch, attendance records stripped of personal details could help show unusual absence patterns. A useful review would compare similar workplaces and days, allow for normal leave and other events, and explain which workers it covers. A sample drawn from one job type or region should not quietly become a national estimate.
Output evidence needs another step: showing what changed in work done and why the launch caused that change. Researchers would need to explain catch-up, cover, tasks moved elsewhere, and the period studied. A backlog the next day would not settle the week’s outcome.
The most useful update would publish enough inputs and methods for someone else to reproduce the result. A confident headline, a repeated attribution, or an unrelated leisure study would not resolve the missing links. Until better evidence appears, the defensible verdict remains uncertainty about the national total. The release countdown can track the calendar without converting anticipation into an economic measurement.
Frequently asked questions
Is the 1.5 million GTA 6 sick day figure verified?
No verified national headcount was located in the reviewed material. IBTimes’ qualifying report also identifies that uncertainty. This means the number should be labeled unverified, not declared false or presented as a count of approved leave requests.
Does the $562.68 million calculation disprove $1 billion?
It shows that 1.5 million workers, eight hours, and $46.89 per hour produce $562.68 million. Different assumptions can produce different totals. Neither amount becomes a measured national loss through multiplication; the headcount, hours, value measure, and recovery all need evidence.
Can approved vacation still cause disruption?
Yes, it can create scheduling pressure if coverage is difficult. It can also be accommodated through planning. The effect depends on what happens to the work, so approved leave should not automatically be counted as permanently lost production. The launch checklist can help keep personal preparation organized.
Is the calculator a forecast or a study?
No. It applies two disclosed formulas to user-selected inputs. It contains no sampled attendance observations and does not estimate a causal economic effect. Its purpose is to make assumptions inspectable and calculations reproducible.
What is the confirmed GTA 6 launch date?
Rockstar’s official announcement lists Thursday, November 19, 2026, as checked October 23. That confirms a schedule, not the number of workers taking leave or the economic consequences.
The verdict: plan for the date, question the total
The GTA 6 sick day story raises a fair question about work schedules. Its national headline, though, goes beyond what the sources can show. The 1.5 million headcount remains unverified. The model behind the paired numbers is unclear. Change the inputs and the math produces a different total.
For any new estimate, ask how it was made: whose absences, which hours, what value per hour, and how much work stays undone. For personal planning, use the launch checklist and confirmed release facts. A striking dollar figure should start the questions, not end them.
Sources and verification notes
Sources were checked on October 23, 2026. Publisher-displayed timestamps are not independently archived version histories.
Editorial responsibility: ViceLens Editorial prepared this source-based analysis and the original scenario calculations under our editorial policy. The article was developed with AI assistance and checked against the linked material. No interview with the economist or access to employer attendance records is claimed.
- Rockstar Games: release announcement, dated November 6, 2025. Official schedule support.
- Cadena SER: July 28, 2025 article, Javier Díaz, displayed at 07:05 CEST. Written page reviewed; audio not reviewed.
- IBTimes UK: September 7 report, Jim Manzon, 08:27 BST; same-day qualification, Rohit David, 09:03 BST. Evidence of reporting and qualification, not independent datasets.
- IBTimes UK: October 20 assessment, Emmanuel Morilla, 23:12 BST. Later discussion of evidentiary gaps.
- BLS: Employer Costs for Employee Compensation, June 2026 reference period, released September 9, 2026. Labor-cost input only; the tables and reverse calculations are original illustrative arithmetic.